

Consumer Trade-Down Behaviour: What It Means and How Malaysian Brands Can Respond
A market research view of how consumers adjust their spending under cost pressure, the Malaysian picture since 2024, and what Budget 2027 may change.

When prices rise or household budgets tighten, consumers rarely stop buying. They buy differently. This shift is called consumer trade-down behaviour, and it is one of the most useful patterns for brands, retailers and market researchers to understand, because it changes who wins and loses in a category without changing how many people are in it.
Malaysia is a revealing case. Inflation has stayed low, the economy has grown strongly, yet analysts and consumer groups keep describing households that are cautious, price-aware and selective. With Budget 2027 now tabled, the key question for brands is whether this behaviour will fade or stay.
At a glance:
- Trade-down means choosing cheaper brands, sizes, channels or substitutes while still buying in the category.
- In Malaysia, evidence points to value-seeking rather than withdrawal: consumers still visit stores but control spend per visit.
- Budget 2027 raises the minimum wage to RM2,000 from June 2027 and lifts cash aid and tax relief, which should help, but unevenly and with a delay.
- The decisive research question is whether trade-down is temporary (reversible) or structural.
What is consumer trade-down behaviour?
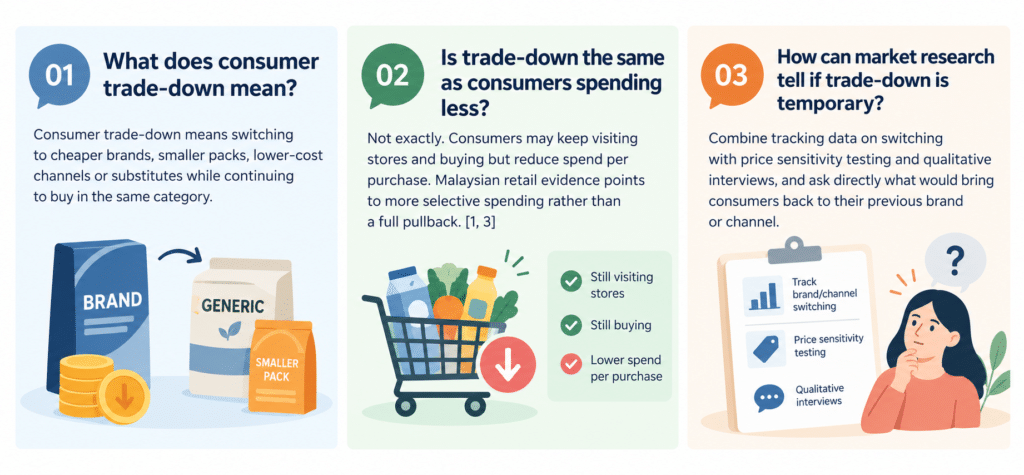
Consumer trade-down behaviour is the tendency of shoppers to move to lower-priced options in response to financial pressure or a change in how they judge value, while continuing to buy in the same category. It is a change in how people spend, not necessarily whether they spend.
Trade-down shows up in several forms. Most categories see more than one at the same time:
Type of trade-down | What it looks like | Illustrative Malaysian example |
Brand | Moving from premium or international brands to mid-tier or local brands | Switching from an imported coffee brand to a local instant coffee mix |
Size or format | Buying smaller packs or lower-priced formats to keep each purchase affordable | Choosing sachets or small packs over family-size packs |
Channel | Shifting to wholesale, discount, convenience or marketplace channels | Moving some grocery spend from hypermarkets to value retailers or online promotions |
Category | Swapping to a cheaper substitute | Cooking at home more often instead of dining out |
Frequency or occasion | Buying the same product less often or only for special occasions | Keeping premium products for festive seasons |
Private label | Choosing store brands over name brands | Switching to a retailer’s house brand for staples |
The opposite pattern is trade-up, where consumers pay more for perceived quality, a theme popularised by Silverstein and Fiske in their work on “trading up”.
Many markets show both at once: shoppers economise on everyday items so they can afford a few selective indulgences.
Why trade-down matters: temporary or structural?
For a brand, the commercial impact of trade-down depends on its cause and its permanence. If households are simply managing a cash-flow squeeze, they may return to preferred brands when conditions improve. If they discover that a cheaper alternative is “good enough”, the shift can become permanent.
Malaysian history offers a useful reminder. In an Ipsos and SSI survey fielded in October 2014, 40% of 873 Malaysian shoppers said they bought more private-label products than in the previous year, and 53% of private-label buyers cited lower prices as the main reason. Importantly, 25% saw no quality difference between branded and private-label items. When quality perception closes the gap, price-driven switching becomes harder to reverse.
This is why the reversible-versus-structural question should sit at the centre of any trade-down study. It determines whether a brand:
- Should defend price with promotions
- Redesign its pack and price ladder, or
- Reinforce what justifies a premium
How market researchers measure trade-down
No single method explains trade-down. The strongest designs combine behavioural data with attitudinal and qualitative evidence.
Method | What it reveals | Example research question |
Tracking and purchase data | Changes in basket size, purchase frequency, brand and channel switching | Has average spend per visit fallen while visits increased? |
Price sensitivity research | Acceptable price ranges and the points where consumers switch | At what price do shoppers move to an alternative? |
Segmentation analysis | Which groups trade down most (income band, region, life stage) | Do B40, M40 and T20 households behave differently, and does Klang Valley differ from other states? |
In-depth interviews, shop-alongs, diaries | What people give up, what they refuse to compromise on, and how they feel | Which categories are protected, and which are first to be cut? |
Return-intent questions | Likelihood of going back to the previous brand or channel | If your income rose by 10%, what would you change first? |
Three diagnostic questions help separate a passing squeeze from a lasting shift:
- What are consumers trading away?
- What will they not compromise on?
- What would bring them back?
The Malaysian scenario: three years of adjustment
A low-inflation economy that still feels expensive
Headline figures look benign. Bank Negara Malaysia reported headline inflation of 1.9% in the second quarter of 2026, up from 1.6% in the first quarter, mainly because of higher external costs linked to the West Asia conflict, especially fuel. The Department of Statistics recorded 1.9% again for August 2026.
Yet the Prime Minister has acknowledged that people still feel cost-of-living pressure from rising prices of goods and certain services. Consumer groups describe a “middle-income squeeze” in which housing, transport, childcare, education and healthcare absorb M40 disposable income. This gap between official inflation and lived experience is where trade-down thrives.
Policy changes that reshaped household budgets
Since 2024, subsidy reform has altered everyday costs. Diesel subsidies were rationalised in Peninsular Malaysia on 10 June 2024, raising the retail price by RM1.20 to RM3.35 per litre. Malaysia then moved to a targeted RON95 subsidy (BUDI95) from 30 September 2025, with eligible users paying RM1.99 per litre. The principle is to protect targeted groups, but households outside the targeted groups face market prices. In August 2026, the average market price of unsubsidised RON95 was RM3.75 per litre.
What the trade-down evidence shows
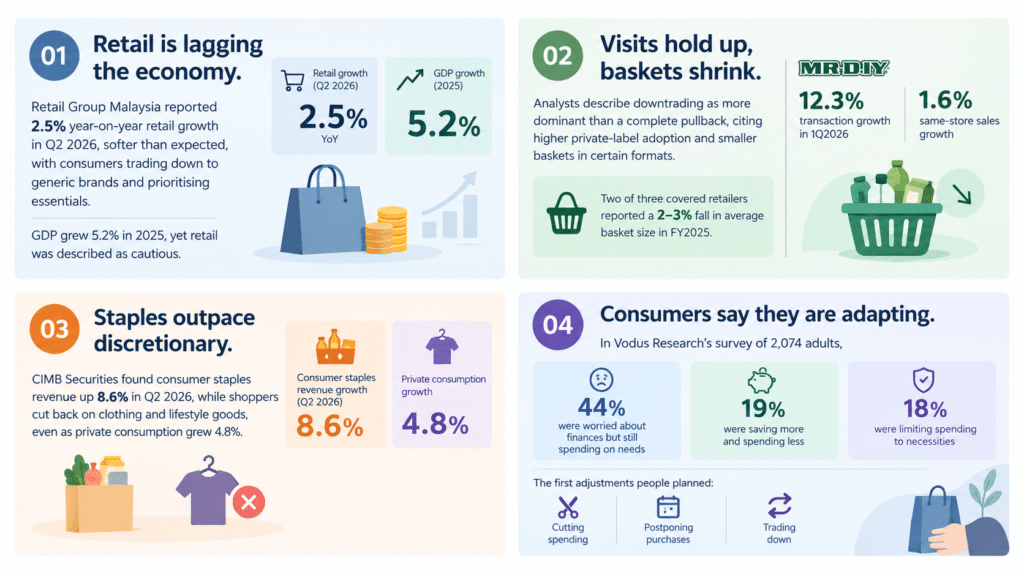
Malaysian Market Context: trade-down is not uniform
Averages hide important differences.
In August 2026, nine states recorded inflation above the national rate: Negeri Sembilan led at 2.5%, followed by Johor, Kedah, Pahang and Labuan at 2.3%, while Selangor and Kuala Lumpur were at 2.1%.
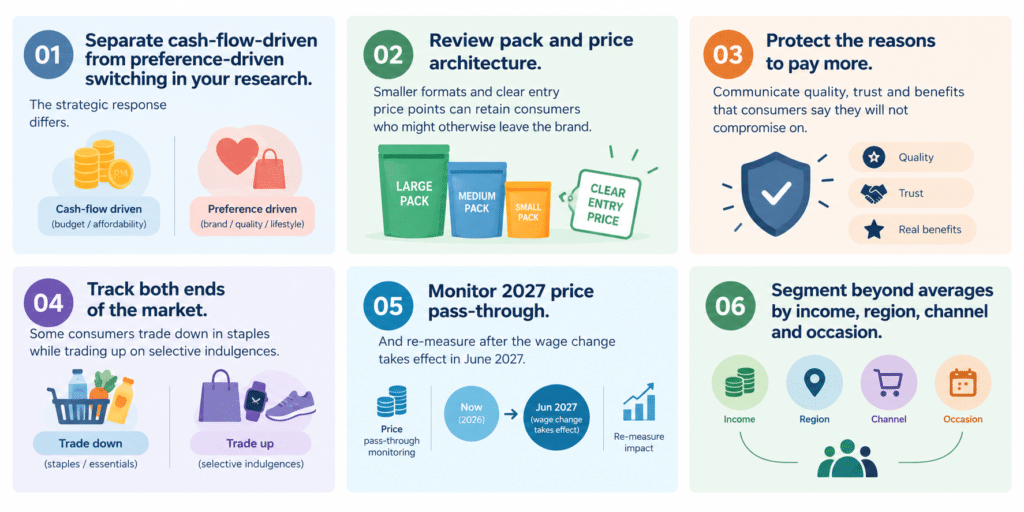
For FMCG, retail and F&B clients, this supports segmenting by income band, state or region, channel (kedai runcit, mini-market, hypermarket, online) and festive occasion. Festive periods such as Chinese New Year and Hari Raya have been cited as supports for retail spending, so trade-down in everyday purchases can coexist with generous spending on celebrations.
Note that most public evidence comes from analyst commentary and company results. Primary consumer research by category remains a clear opportunity.
Budget 2027: what it means for trade-down
Budget 2027, tabled on 9 October 2026, centres on easing cost-of-living pressure. Key consumer-related measures include:
- A higher minimum wage of RM2,000 (from RM1,700) from June 2027, with exemptions for micro, small and medium enterprises with annual sales below RM50 million.
- A new RM2,500 minimum monthly salary for semi-skilled workers and graduates as a first step in wage framework reform.
- Higher individual tax relief, reported as rising from RM9,000 to RM12,000.
- Cash assistance through STR and SARA increased from RM15 billion to RM16 billion.
Analysts had framed the budget as moderately expansionary, with a general election that could be called at any time.
Our assessment: four things to watch
- Timing. The wage floor takes effect in June 2027, so first-half 2027 behaviour is likely to resemble today’s.
- Uneven relief. Cash aid and wage increases help B40 and lower-M40 households most. Tax relief may ease the middle-income squeeze, but it is unlikely to restore premium purchasing quickly.
- Cost pass-through. Consumer groups have warned that wage increases must consider employers’ capacity so that higher costs do not flow into prices. Producer prices rose 10.7% year-on-year in August 2026, a 50-month high, though prices of finished consumer goods rose only 1.5% so far. If that gap closes, wage gains could be offset by higher shelf prices.
- Reversible versus structural. Relief addresses cash-flow-driven trade-down better than preference-driven trade-down. Where consumers have discovered that local or private-label options are good enough, they may not return.
These points are our interpretation, not forecasts. Actual behaviour will depend on how the measures are implemented and how prices move.
What brands and researchers should do now
Frequently asked questions
Key takeaways
- Trade-down is a change in how people buy, not whether they buy.
- Malaysia combines low inflation with cautious, value-seeking consumers, and retail has trailed the wider economy.
- Budget 2027 offers relief through wages, tax relief and cash aid, but the main wage change starts in June 2027, and cost pass-through remains a risk.
- The key research question is whether trade-down is temporary or structural, and the answer will differ by category and segment.
Metrix Research is a Malaysia-based market research consultancy helping brands and businesses make better decisions through robust consumer insights and evidence-based research.
Need to understand trade-down in your category? Our research team can design a study that measures switching, price sensitivity and return intent across Malaysian consumer segments. Contact us to discuss your category and objectives by exploring our website or contact us today.
For more articles, please explore insights
References
- Blueweave Consulting (n.d.) Malaysia Halal Food Market. Available at: https://www.blueweaveconsulting.com/report/malaysia-halal-food-market
- Christensen, C.M., Hall, T., Dillon, K. and Duncan, D.S. (2016) ‘Know your customers’ “jobs to be done”‘, Harvard Business Review, September.
- Commission Factory (n.d.) Ecommerce Fashion in Malaysia.
- Department of Statistics Malaysia (DOSM) (2026) Malaysia’s Micro, Small and Medium Enterprises (MSMEs) Performance 2025, media statement, 30 July.
- Food N Hotel Asia (n.d.) Why Asian Consumers Seek Healthier Food Options. A
- GlobalData (2024) Q3 consumer survey, as reported in Asia Food & Beverages (n.d.) The Future of Functional: What’s Next for Malaysia’s Functional Food and Beverage Industry.
- Industry Research Biz (n.d.) Halal Food and Beverage Market Size & Forecast.
- Janio Asia (n.d.) 5 Malaysian Women’s Fashion eCommerce Market Trends.
- Kotler, P. (2003) on niche marketing criteria, as cited in MBA Knowledge Base (n.d.) Introduction to Market Segmentation.
- Malay Mail (2024) ‘DOSM: Malaysia to become aged nation by 2040 with population over 60 set to surge’, 6 September.
- Mordor Intelligence (2026) Asia-Pacific Halal Food and Beverage Market
- Nexdigm (n.d.) Malaysia Fashion E-Commerce Market Outlook to 2030.
- SME Corporation Malaysia (n.d.) Profile of MSMEs 2015-2024.